How to visualize Spring Boot 2 metrics with Micrometer and Prometheus
Introduction
Spring Boot Actuator it is a great sub-project which allow us to manage and monitor your Spring Boot application. In Spring Boot 1.x we could access the /metrics endpoint to retrieve metrics such as memory usage, CPU performance and so more.
The main limitation with the previous version is that metrics were single values, and organized in a hierarchical way:
  {
"httpServerRequests.exception.None.method.GET.status.200.uri./health.snapshot.95thPercentile": 6,
 "httpServerRequests.exception.None.method.GET.status.200.uri./health.snapshot.mean": 5,
 "httpServerRequests.exception.None.method.GET.status.200.uri./health.snapshot.median": 5,
 "httpServerRequests.exception.None.method.GET.status.200.uri./health.fifteenMinuteRate": 0.04986034224168091,
 "httpServerRequests.exception.None.method.GET.status.200.uri./health.snapshot.max": 231,
 "httpServerRequests.exception.None.method.GET.status.200.uri./health.oneMinuteRate": 0.047751970036766365,
 "httpServerRequests.exception.None.method.GET.status.200.uri./health.snapshot.98thPercentile": 6,
...
As you can see in the previous example, the amount of metrics could become overwhelming very quickly, and this is just an example of the success responses (200) of the /health endpoint.
One of the biggest improvements in Spring Boot 2 is the support of Micrometer. Micrometer defines itself as“a simple facade over the instrumentation clients for the most popular monitoring systems, allowing you to instrument your JVM-based application code without vendor lock-in. Think SLF4J, but for metrics“. Micrometer supports numerous monitoring systems but in this post we will only focus on Prometheus.
Micrometer instead of working in a hierarchical style works in a dimensional way. Therefore, now when we check the metrics endpoint we won’t find a key pair of metric and value. Instead we will find a list of all available metrics:
{
  "names": [
    "http.server.requests",
    "jvm.buffer.total.capacity",
    "tomcat.servlet.request.max",
    "jvm.buffer.count",
    "tomcat.threads.busy",
    "tomcat.servlet.request",
    "process.start.time",
...
}
In order to retrieve any metric value and meta-data we will need to use the metric name in the path, for instance: app_url/actuator/metrics/http.server.requests:
{
  "name": "http.server.requests",
  "description": null,
  "baseUnit": "seconds",
  "measurements": [
    {
      "statistic": "COUNT",
      "value": 176
    },
    {
      "statistic": "TOTAL_TIME",
      "value": 2.2570988560000003
    },
    {
      "statistic": "MAX",
      "value": 0.230505727
    }
  ],
  "availableTags": [
    {
      "tag": "exception",
      "values": [
        "None"
      ]
    }
...
The latest version of Spring Boot Actuator apart from Counters and Gauges includes Timers which allow us to analyze latencies or frequencies of events. This type of information would be very hard to read in a hierarchical view but it is very powerful when you use a monitoring tool such as Prometheus.
Spring Boot 2.x metrics
One of the first things that you need to be aware when you are upgrading from spring Boot 1.x to 2.x is that the new endpoints are prefixed with the “/actuator” path. So if you used to check the health status of your application in http://localhost:8080/health now is http://localhost:8080/actuator/health, and the same applies to the other endpoints: metrics, env…
The second important thing that you need to be aware is that by default everything is secured, including the actuator endpoints (except health and info). You could define custom security rules for each endpoint but in this post we are just going to expose them all.
Please follow this steps to configured your Spring boot application with Prometheus:
- In order to have all the actuator endpoint available you will need to add the following property to your application.properties:
“management.endpoints.web.exposure.include”=”*” - Add the Micrometer registry dependency for Prometheus. This dependency will publish your metrics into the /actuator/prometheus endpoint, in a format that Prometheus will be able to process:
<dependency>
	<groupid>io.micrometer</groupid>
	<artifactid>micrometer-registry-prometheus</artifactid>
</dependency>
3. Add a new class to customize your micrometer registry. In this case we are adding a new global tag to identify the application. Furthermore, we configure a TimedAspect which will allows us to use the @Timer annotation later on.
/**
 * Micrometer registry configuration
 */
@Configuration
public class RegistryConfig {

	@Bean
	MeterRegistryCustomizer<MeterRegistry> metricsCommonTags() {
		return registry -> registry.config().commonTags("app.name", "my app");
	}

	@Bean
	TimedAspect timedAspect(MeterRegistry registry) {
		return new TimedAspect(registry);
	}
}
4. Now you can add the @Timed annotation to any of your methods and you will be able to record how many times has been invoked and for how long.
@Timed("hello-world")
public String helloWorld(){
    return "Hello World!";
}
5. Start your application and test it by hitting any endpoint or method annotated with @Timed.
Prometheus
Prometheus is an open-source monitoring solution which will allow us to process the metrics and visualize them.
To run Prometheus:
- Go to https://prometheus.io/ and download the latest version. Please be aware that it doesn’t work well with some old browsers.
- Extract the project and inside the folder you should find a configuration file called “prometheus.yml” file. Modify the scrape_configs section and add your application url port and set the metrics path to /actuator/prometheus
scrape_configs:
  - job_name: 'spring'
    metrics_path: '/actuator/prometheus'
    static_configs:
    - targets: ['localhost:8080']
3. Run the prometheus executable file. By default, the web application starts in localhost:9090
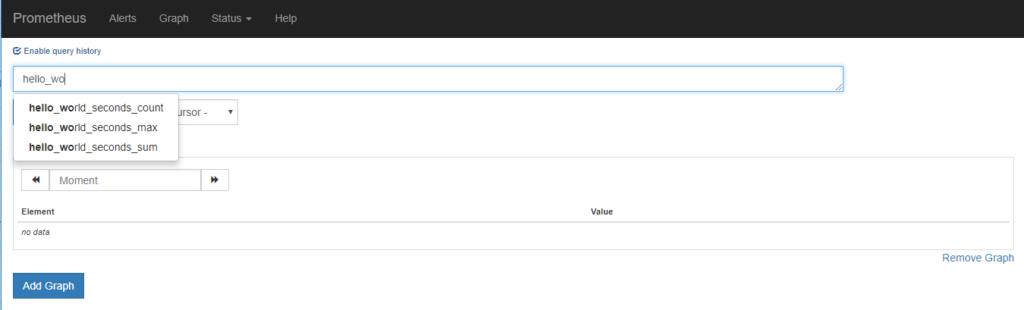
4. Select a metric from the text box. Prometheus can autocomplete your query which it is very convenient when you have lots of metrics.
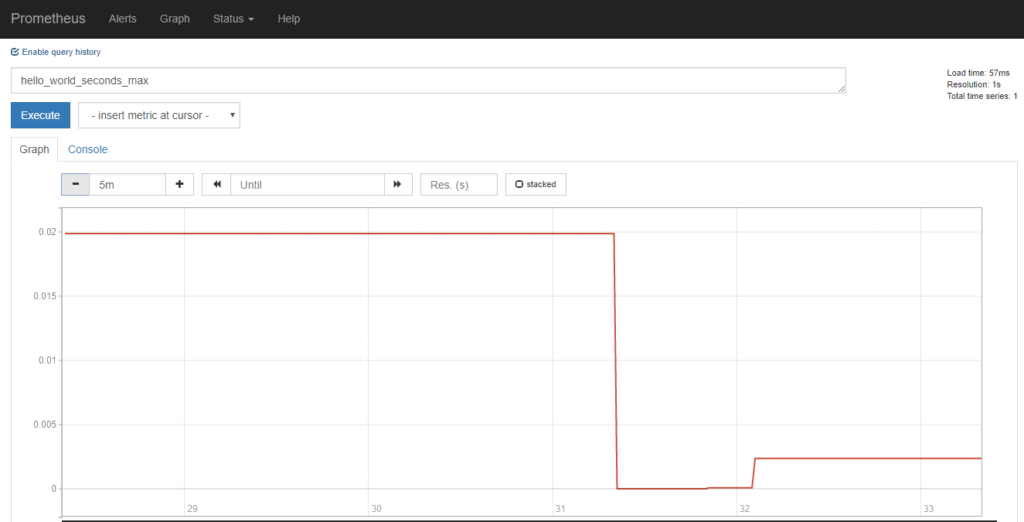
5. Execute your metric and check the results in a graph or the in the console.


Can you please share GitHub repo URL?
I am facing some issue in class RegistryConfig . Want to check its full definition (including package path).
Thanks.